Hello there! This week we’re providing you with directions on how to perform your own step-by-step budget analysis! This is less of our usual general education and more of a recommended exercise to get your arms around where your money is really going. Without further ado, let’s jump into it!
First, The Data
This exercise is best completed through the use of excel or google sheets. To get the information you need, log into your primary bank account. Almost all banks will have an option to export your transactions to an excel file (.csv or .xsl). You will want to export up to the last year of transactions in this format or as far back as they’ll let you if the date range is limited to 90 days, 6 months, etc. Once you’ve downloaded it, open the file in Excel or upload the file to Google Drive to open it in Google Sheets. If you do most of your spending through a credit card, feel free to use the transaction download from that card to perform the analysis. What’s important is that we’re tracking where most of our “spending” occurs, rather than where big line items like mortgage payments or pre-tax deductions happen on our pay stub.

Formatting Your Transactions
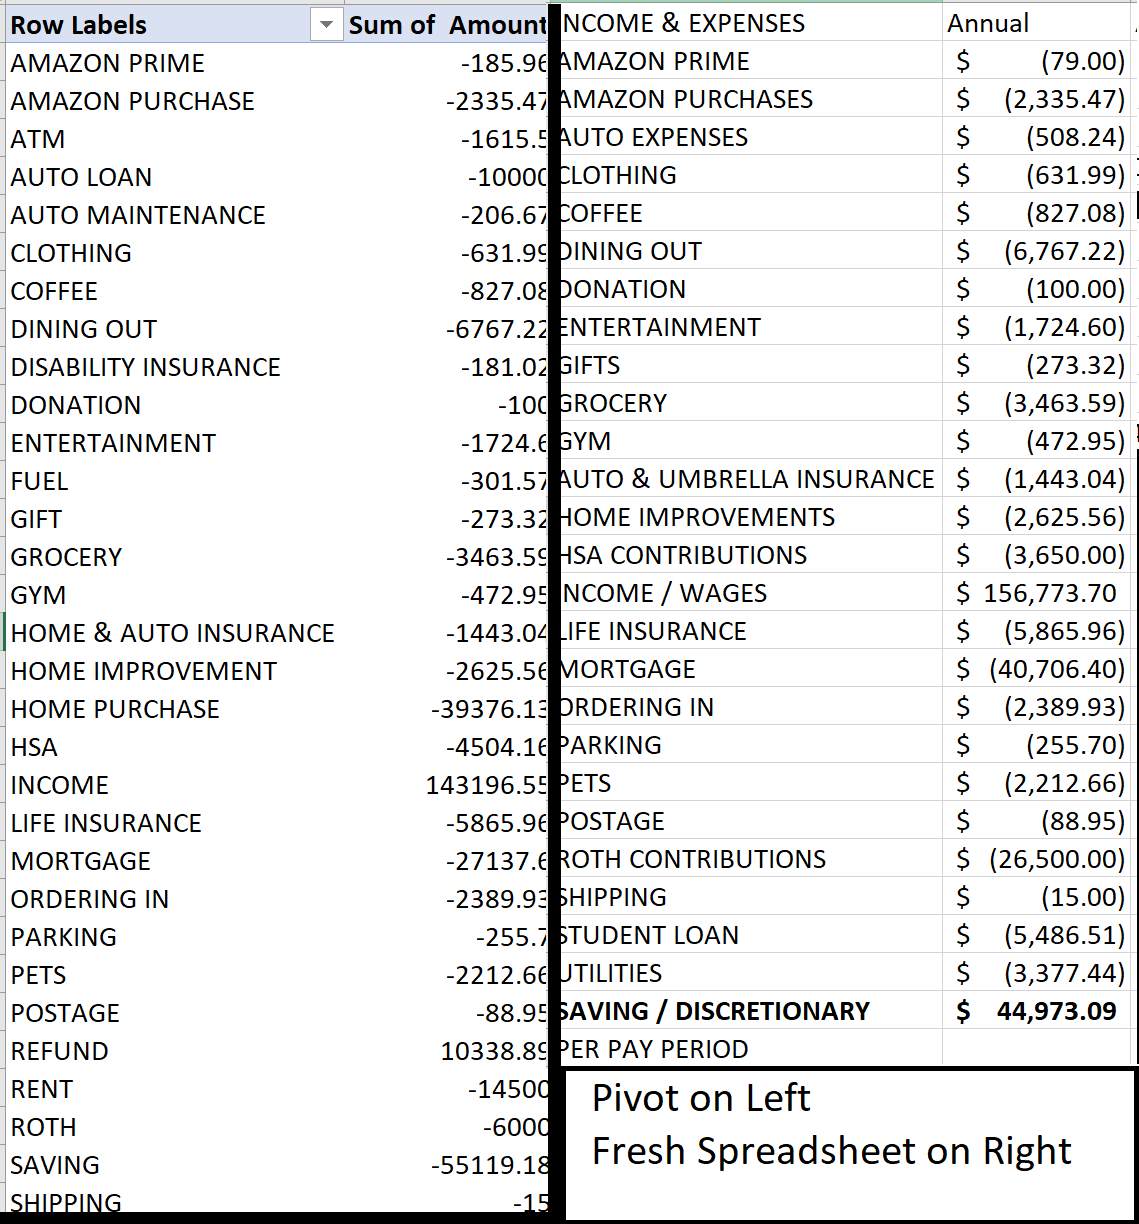
Once you have your file open, you’ll find that it probably comes with a lot of data that isn’t necessary for this exercise. Delete any columns that don’t have the value of each transaction (positive or negative) and the name of each transaction. This means you can delete items such as the date, time, and whether a transaction was a withdrawal or deposit from the sheet. We just need to see transaction numbers and transaction names. Once we’ve gotten to this point, highlight all of your remaining data (just the transaction values and transaction names) and sort them by the name of the transaction. This means you should get all of your transactions lined up in alphabetical order, which will help by clumping a lot of items together, such as all of your amazon purchases, target purchases, and grocery store purchases. At this point, you’ll want to think about the categories of your spending. Rename each transaction in its description, for example replacing “AMAZON.COM* AMAZON.COM SEATTLE, WA, USA” with just “AMAZON” so that way when you’re done with this part, you can categorize each transaction into one big group for your budget analysis. Try to avoid ultra-specific things like “Starbucks,” but instead use generic labels such as “coffee” so you don’t end up with multiple store-specific expenses. Some examples of categories are below, along with a before and after view.
- Amazon
- Auto Expenses
- Child Expenses
- Clothing
- Coffee Dining Out
- Day Care
- Donations
- Entertainment
- Gifts
- Grocery
- Gym
- Auto & Umbrella Insurance
- Home Improvements
- HSA Contributions
- Income / Wages
- Life Insurance
- Loan Payments
- Mortgage Payments (P&I, Taxes, and Homeowner’s Insurance)
- Ordering In (Delivered Food)
- Parking
- Pets
- Postage
- Retirement Contributions
- Utilities

Seeing Your Budget
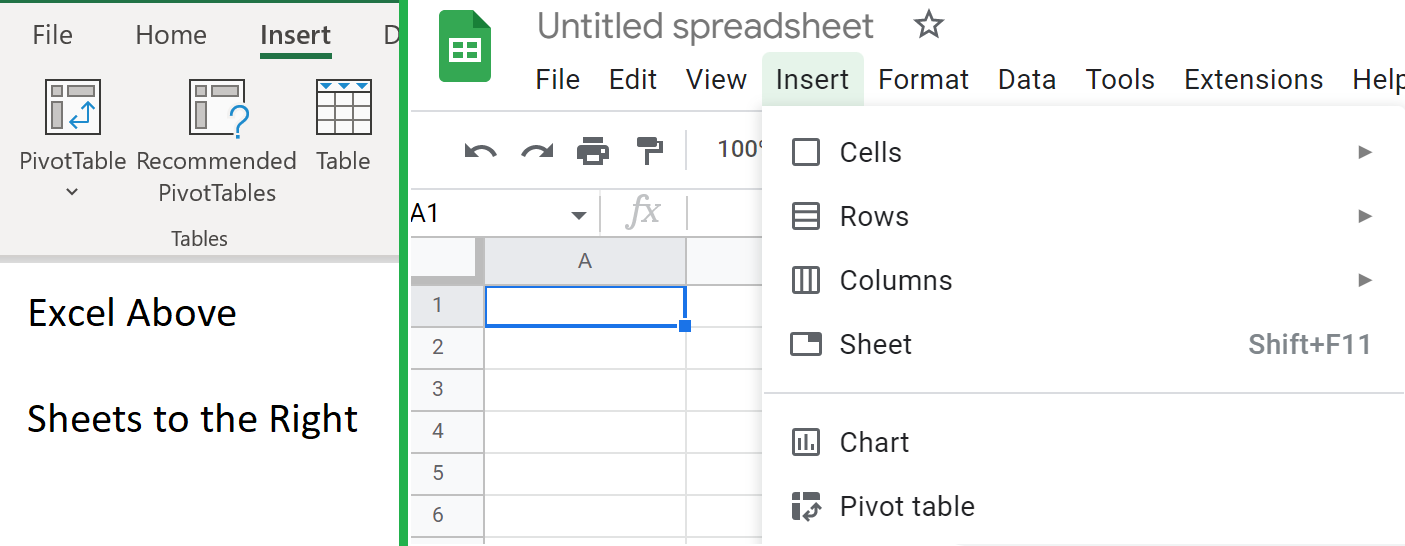
Once you have completed the re-categorization of your transactions, you should have approximately 15-30 types of transaction across the many hundreds or thousands of transactions you’ve completed in the last year. Highlight the entire dataset, and create a pivot table.

Once your table exists, open up the Descriptions and Amount tabs to show a consolidated list of your expenses. If you were able to pull an annual report, this shows your real spending over the last year. If you pulled the transactions for 6 months, 3 months, etc., you’ll need to multiply appropriately to get to your annual budget. With this data in place, copy the data in the pivot table onto a fresh spreadsheet. Remember that the pivot is only showing you your transactions and may not account for things like your 401(k) contributions or paying health insurance premiums through work, along with income taxes, including state, federal, and FICA/OASDI; add these expenses onto your fresh spreadsheet with the output from the pivot table, and replace your income and wages data in the table with your gross pre-tax and pre-deduction compensation from your pay stubs or W2. Now you have a completed summary of your income and expenses.

What can you do with this information?
This can give you a few critical items: First, are you underspending, over-spending, or essentially breaking even? In the case where your budget shows that you have more than 5% of your income left over after all expenses are accounted for, you probably have a healthy buffer of extra income that can be committed to dedicated savings or making extra debt payments. If your budget shows that you’re breaking even, essentially spending 5% over or under your income, then this is probably “squishy,” and not indicative that you’re over or underspending in a way that needs to concern you. On the other hand, if you’re overspending by more than 5% of your income, then you should review the expense data and consider a few things: Are there big one-time transactions on here that are biasing the answer? Is there an ongoing expense you don’t really need anymore (i.e. a streaming subscription you don’t ever watch)? Or is there some form of luxury spending that’s overdoing it, such as dining out or a hobby that keeps getting more expensive as time goes on?
Knowing Your Budget
Knowing your budget is power. Overspending can sneak up on us when we’re not careful, whether it’s due to inflation or lifestyle creep. In turn, unallocated excess savings can build up in a way that hinders our long-term financial plan. It’s not to say that extra cash is a bad thing, but I’ve seen people build up over a million dollars in cash without thinking about it over the decades, resulting in several times that in opportunity costs that kept them working longer than intended. This is an exercise I recommend people check on at least annually, or quarterly if you feel like your budget management is in need of work. If you’re an existing client, please feel free to reach out to us to work on this with you, and if you’re not, don’t hesitate to ask!
Dr. Daniel M. Yerger is the President of MY Wealth Planners®, a fee-only financial planning firm serving Longmont, CO’s accomplished professionals.

